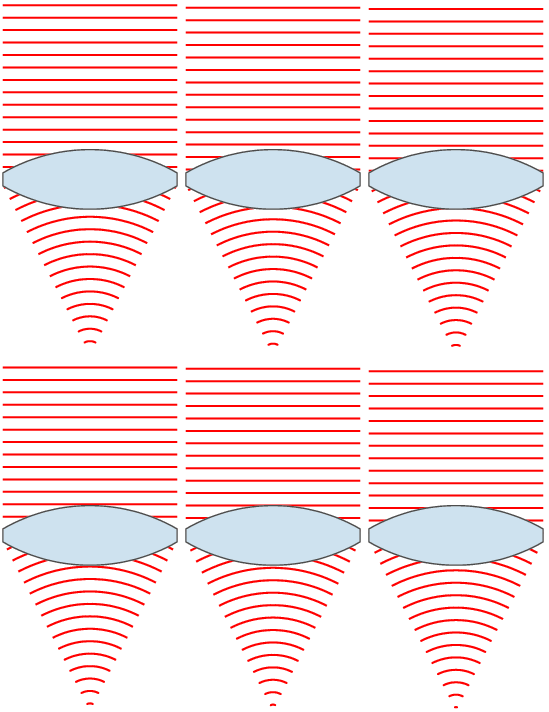
ملف:Lens and wavefronts.gif

محتويات الصفحة غير مدعومة بلغات أخرى.
من ويكيبيديا، الموسوعة الحرة

Lens_and_wavefronts.gif(183 × 356 بكسل حجم الملف: 35 كيلوبايت، نوع MIME: image/gif، ‏ملفوف، ‏9 إطارات، ‏0٫7ث)

slnglelens

ملخص

الوصف Illustration of wavefronts after passing through a lens. Interestingly, to produce a point source reverse the direction of the waves, with the focus point acting as a point source.
التاريخ (UTC)
المصدر self-made with MATLAB
المؤلف Oleg Alexandrov
إصدارات أخرى
 
.هذا الرسم المتجهي أُنشئ بواسطة MATLAB

ترخيص

Public domain أنا، مالِك حقوق تأليف ونشر هذا العمل، أجعله في النِّطاق العامِّ، يسري هذا في أرجاء العالم كلِّه.
في بعض البلدان، قد يكون هذا التَّرخيص غيرَ مُمكنٍ قانونيَّاً، في هذه الحالة:
أمنح الجميع حق استخدام هذا العمل لأي غرض دون أي شرط ما لم يفرض القانون شروطًا إضافية.

siingleline

% Illustration of planar wavefronts going through a lens and getting focused
% into a converging spherical wave

function main ()

  % lens index
   n=1.5; 

  % number of points, used for plotting
   N = 100;

  % radii of lens surfaces
   R1 = 0.5; 
   R2 = 1.5;

  % centers of circles (y coord is 0)
   O1 = -2.9;
   O2 = -O1;

  % focal length
   f = (n-1)*(1/R1+1/R2); f = 1/f;
   
   % theta0 determines the width of the lens
   theta0=pi/6;
   Theta = linspace(-theta0, theta0, N);

  % right face of the lens
   L1x = R1*cos(Theta)+O1;
   L1y =R1*sin(Theta); 

   % left size of the lens
   L2x=-R2*cos(Theta)+O2;
   L2y = R2*sin(Theta);

   % flat top part
   Topx = [L1x(N), L2x(N)];
   Topy = [L1y(N), L2y(N)];

   % flat bottom part
   Botx = [L1x(1) L2x(1)];
   Boty = [L1y(1), L2y(1)];

   % the lens
   Lensx = [L1x rv_vec(Topx), rv_vec(L2x), Botx];
   Lensy = [L1y rv_vec(Topy), rv_vec(L2y), Boty];

   % Parameters for graphing
   Lens_color  = [204, 226, 239]/256;
   Lens_border = 0.3*[1, 1, 1];
   lbw = 1.3; % lens border width
   wavefr_color = [1, 0, 0];
   wavefr_bdw   = 2;
   
   % spacing between wavefronts (both plane and spherical ones)
   spacing = 0.25;

   % 2*H is the height of the plane wavefronts
   H = L1y(N); 

   % theta2 = slope of the line going from the upper-right
   % end of the lens to the focus point
   theta2 = atan(L1y(N)/(f-L1x(N)));

   % Shape of the spherical wavefronts.
   Theta = linspace(-theta2, theta2, N);
   X = -cos(Theta);
   Y =  sin(Theta);

   S = -f; % start ploting waves from here to the right

   % number of frames in the movie
   num_frames = 10;
   Shifts = linspace(0, spacing, num_frames+1);

   % start at S+shift, plot the wavefronts
   for frame_no = 1:num_frames

      shift = Shifts(frame_no);
      
      s = S+shift;

      % plotting window
      figure(1); clf; hold on; axis equal; axis off;

      % plot the plane wavefronts
      while s < 0
         plot([s, s], [-H, H], 'color', wavefr_color, 'linewidth', wavefr_bdw);
         s = s + spacing;
      end
      
   
      % plot the spherical wavefronts
      s = s - 10*spacing; % backtrack a bit
      while s < f
         
         rho = f-s;
         
         if rho*Y(N) <= L1y(N)
            plot(rho*X+f, rho*Y, 'color', wavefr_color, 'linewidth', wavefr_bdw);
         end
         
         s = s + spacing;
         
      end

      % plot the lens
      fill(Lensx, Lensy, Lens_color, 'EdgeColor', Lens_border, 'LineWidth', lbw);
%      get(H)
%      return
      
      % Invisible points to force MATLAB to keep the
      % plotting window fixed.
      tiny = 0.15*spacing;
      white = 0.999*[1, 1, 1];
      plot(S-tiny,   H+tiny, 'color', white);
      plot(S-tiny,  -H-tiny, 'color', white);
      plot(f+tiny,   H+tiny, 'color', white);
      plot(f+tiny,  -H-tiny, 'color', white);

      % Rotate by 90 degrees
      set(gca, 'View', [90, 90])

      % save current file
      frame_file = sprintf('Frame%d.eps', 1000+frame_no);
      disp(frame_file);
      saveas(gcf, frame_file, 'psc2');
      pause(0.07)
   end

% The frames were converted to a movie with the command
% convert -antialias -loop 10000  -delay 8 -compress LZW Frame100* Lens_and_wavefronts.gif
   
function W = rv_vec(V)

   K = length(V);

   W = V;
   for i=1:K
      W(i) = V(K-i+1);
   end

الشروحات

أضف شرحاً من سطر واحد لما يُمثِّله هذا الملف
Siingleline

العناصر المصورة في هذا الملف

يُصوِّر

٢٤ نوفمبر 2007

تاريخ الملف

اضغط على زمن/تاريخ لرؤية الملف كما بدا في هذا الزمن.

زمن/تاريخصورة مصغرةالأبعادمستخدمتعليق
حالي06:35، 25 نوفمبر 2007تصغير للنسخة بتاريخ 06:35، 25 نوفمبر 2007183 × 356 (35 كيلوبايت)Oleg Alexandrovtweak
04:10، 24 نوفمبر 2007تصغير للنسخة بتاريخ 04:10، 24 نوفمبر 2007171 × 356 (33 كيلوبايت)Oleg Alexandrovtweak
04:09، 24 نوفمبر 2007تصغير للنسخة بتاريخ 04:09، 24 نوفمبر 2007171 × 356 (33 كيلوبايت)Oleg Alexandrovtweak
00:56، 24 نوفمبر 2007تصغير للنسخة بتاريخ 00:56، 24 نوفمبر 2007171 × 359 (33 كيلوبايت)Oleg Alexandrovtweak, same license
00:53، 24 نوفمبر 2007تصغير للنسخة بتاريخ 00:53، 24 نوفمبر 2007171 × 359 (32 كيلوبايت)Oleg Alexandrovtweak
00:49، 24 نوفمبر 2007تصغير للنسخة بتاريخ 00:49، 24 نوفمبر 2007151 × 359 (31 كيلوبايت)Oleg Alexandrov{{Information |Description=Illustration of wavefronts after passing through a [:en:lens (optics)|lens]] |Source=self-made with MATLAB |Date=~~~~~ |Author= Oleg Alexandrov |Permission=see below |other_versions= }}

الصفحتان التاليتان تستخدمان هذا الملف:

الاستخدام العالمي للملف

الويكيات الأخرى التالية تستخدم هذا الملف:

اعرض المزيد من الاستخدام العام لهذا الملف.